Consider a set of data. It consist of 1000 points and the values of each point ranges from 65 to 135 as you can see from the following dispersion plot:
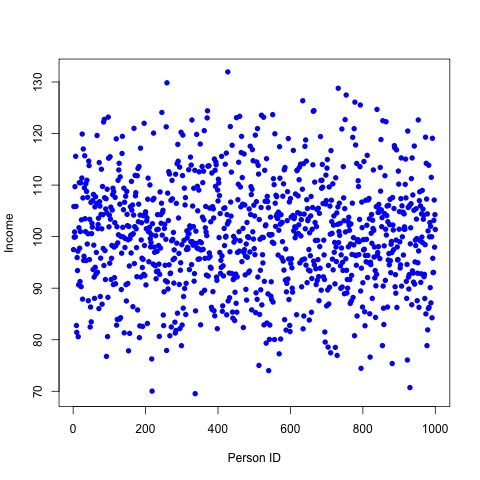
The label of the horizontal axis is Person ID (ranging from 1 to 1000) which correspond to the number associated to each person in a survey. The aim of the survey is to report an estimate of the participants monthly income. The reported income is plotted in the vertical axis. The currency is not important.
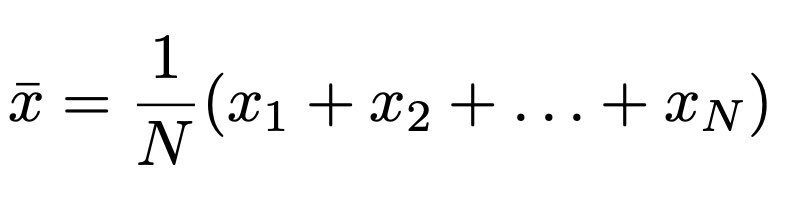
In its core, statistics is a tool that allows to represent the bulk of data with few quantities. The basic quantity is the mean and it is defined as
Hence, the mean value of monthly income corresponds to x-bar. For the data, this value is approximately 100 and it is depicted in the following figure

We see that this number «works» for the values that are around the mean (orange horizontal line).
Notice that are 1000 stories that involve family, friends, etc. There are 1000 stories in which socioeconomic realities are involve. The mean value is blind to these stories.
From the dispersion plot we can see that are persons that earn around 70 and others around 130.
Let us consider another quantity: the standard deviation. Its definition is not important for the discussion1 and it has a value of approximately 10. A student will report that the collective representation of monthly income lies on the interval ranging from 90 to 100.

From the above figure we see that the interval does represent collectively the data but misses some values. These values are the ones that are far from the mean. A researcher may be pleased with the result but if the details of the fluctuations (all the points around the mean) are extremely important, the student will have to work harder.
For this purpose, the student will consider the weighted mean defined as
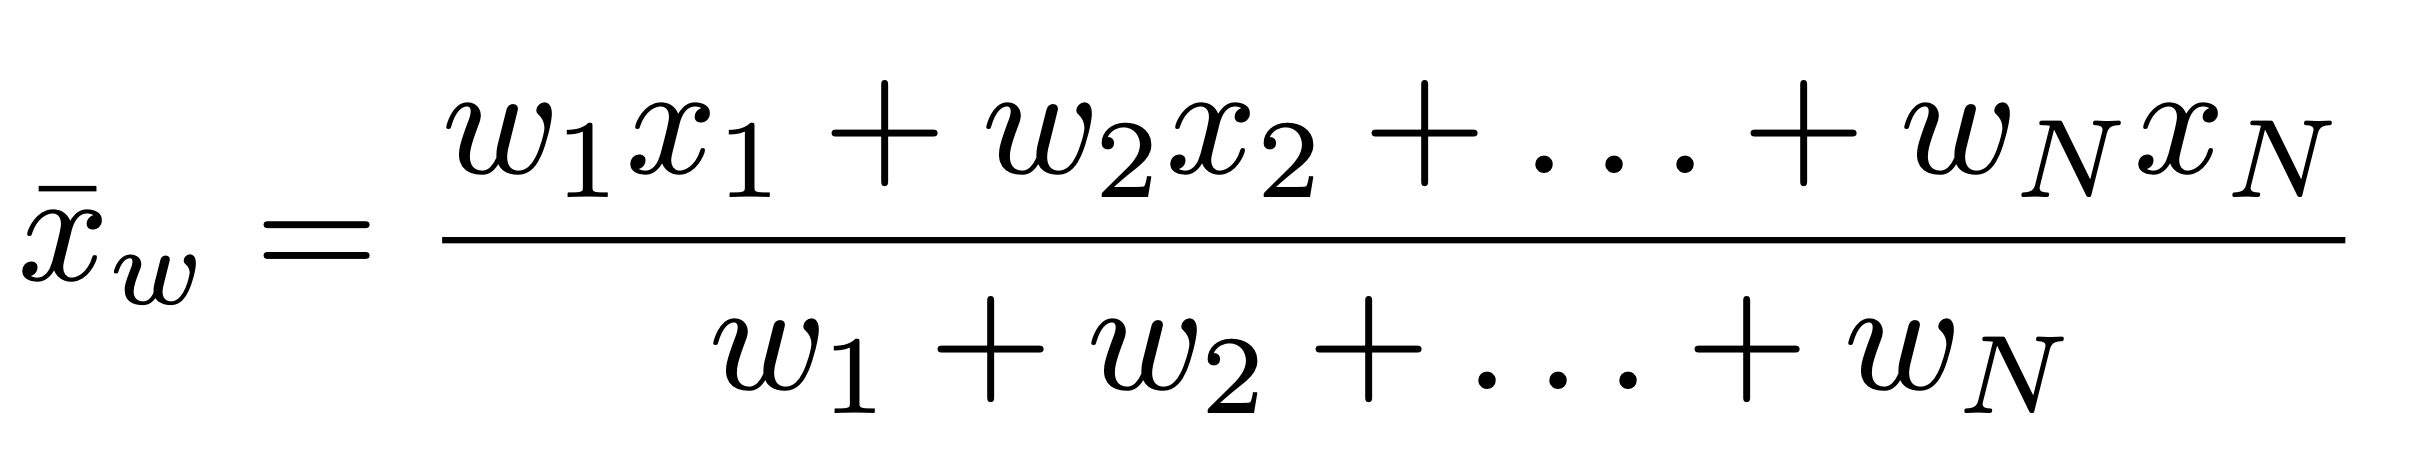
The w’s are called the weights and they are numbers. The first point to make is that if all the weights are equal to 1/N, the weighted mean reduces to the mean. The second point is that per each value of income there is an associated weight. Which number do we assign for each weight and how this help us the understand better the fluctuations?
To answer the question, notice that the weights must be related to particular information of each person in the survey. This means that there should be more questions apart from the estimate of the monthly income. Therefore, the weights model numerically the answers to these other questions. The criteria of asking relevant questions to improve the result is difficult.
This is a big difference between natural science and social science. For the former we have laws of nature that strictly guide us and for the former we do not.
For example, the student can ask if the person have university education or not. The assumption is that people with a university degree earn more. These could be incorporated by assigning larger weight to the persons with this education.
What do we gain?
Well, it will depend on the conditions of the society and individual circumstances of the people in the survey. To illustrate this point, consider the case that by university degree it means having a PhD degree. If this data is taken from a population in Guatemala, there will be few people with this education. Hence, we will be effectively removing the majority of the data and the average will reflect the monthly income of these persons (and I will expect that these new average will be below the other average).
The student presents this result to the researcher and now a «hidden» fact comes to the surface:
What is the purpose of the survey?
So Alice, the researcher, works in some division of a Bank and Bob, a new member of this division, hands the above result. Alice reply Bob: «this is well done but it is useless. Let me remind you that our task is to sell health and life insurance to our customers».
(In the case of Guatemala consider Alice to be Alejandra and Bob to be Carlos).
Bob/Carlos was embarrassed but after some time he realized the failure of its analysis. Fortunately, the survey included other questions like age, if the person is a parent, the number of children (if it is the case) and so on.
As discussed in the last post, Data science in society: humans as numbers, I belong to this useless statistical analysis.
Carlos/Bob understood that the information encoded in the weights must be changed in order to achieve the goal. The weight associated to parenthood is best suited for the analysis.
After some time, he realized that analyzing the full data may not be the best approach. This is supported from the fact that the weights serve (in an extreme case) as data reduction. With the extra information of the survey, he divided the data into smaller subsets.
This is represented in the following picture:

There are many ways, depending on the information, to decompose the full set of data into smaller ones. The key point of this approach, as noted by Carlos, is that the statistical description will simplify and maybe it will reduce the problem of large fluctuations within each subset of data. On the other hand, Bob/Carlos realized that this technique will help him to investigate other questions if Alice decided to change the purpose of the survey.
In this case, Alice’s expertise guides Bob to the determine how to the data will be grouped.
However, it may be that the first result provided by Bob was enough. Maybe just the reported mean of 100 and the standard deviation of 10 suffice Alice to establish a conclusion.
It is possible that Alice is creating a statistical model and she only wanted from Bob an estimation of some parameters. Bob works with descriptive (nonparametric) statistics and Alice with inferential (parametric) statistics.
Alice works with probability distributions and testing hypothesis. The mathematics is more involved as well as the assumptions.
In the next post, the notion of probability will be discuss in detail.
I hope you realize that after you become a number, you are also part of some equations and subsets of data. Humans as numbers… what a world!
Moreover, notice how the criteria is required in statistics. In particular, how the techniques of collecting and analyzing the data must be aligned with the goal of the analysis.
- If you think it does, consider the standard deviation with Bessel’s correction. The use of N-1 instead of N in the formula can be explained simply by noticing that the mean corresponds to a constraint on the data. Thus, it removes one degree of freedom. ↩︎

Deja un comentario